Web-based application for visual interactive exploration of datasets and data reduction.
The idea is to develop a web-based application for visual interactive exploration of datasets and data reduction.
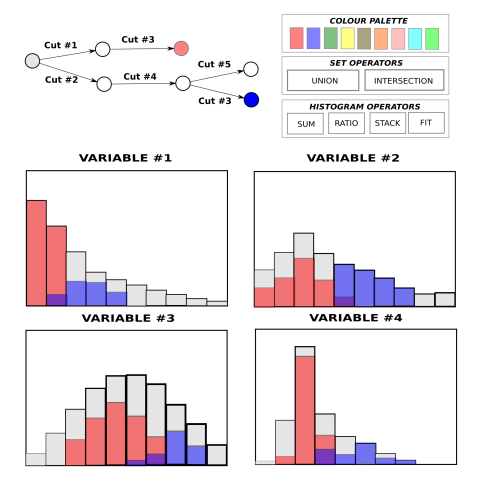
The web application will allow selection of cuts over subsets of the datasets simply by brusing the histograms. More complex histograms and cuts could also be specified. Several data subsets (using different colours) could be considered at the same time in order to compare distrubutions. Many extensions, operator are toolkits are also possible.
Some examples of brusing interactivity by other projects:
These tool could have several use case within HEP (and also some in other fields):
- Easy Analysis for Education and Outreach ( more important due to Open Acces Initiatives)
- Interactive Exploration of Data and Cuts for Physical Analysis
- Data Quality Management
The idea is to have the same architecture than the IPython Notebook ( i.e. Kernel <--zeromq--> Server <--WebSocket--> Web Frontend) and an online and offine mode. State of the exploration and configuration could also be saved to a JSON file.
In the offline mode, the Kernel could be a ROOT or PyROOT interpreter to allow efficient and fast exploration of medium sized TTrees that could be in different files, which can be loaded to RAM to avoid disk I/O bootlenecks. Data format for transfering histograms have to be dediced (JSON based or ROOT based and then use ROOTJS). For the offine mode, a file with the histograms for certain selected subsets (i.e. for cuts for a Physical Analysis) can be exported for ease sharing (think of IPython Notebook Viewer).
This idea might seem too ambitious but several approaches are possible and the complexity could be adjusted to the size and expertise of the team.
- A working prototype of the application concept
- Demo of the app using accesible HEP data (i.e. from CMS Public Data http://cms.web.cern.ch/content/cms-public-data or International Masterclasses)
Any of these or anything else that you consider that could be useful:
- HTML, Javascript, D3.js, Crossfilter, dc.js, ...
- Python Web Frameworks (e.g. Flask or Tornado)
- IPython, PyROOT, Numpy or Scipy
- C++
- ROOT knowledge
- Data Analysis
- Data visualization
- Graphical Interface Design
Prerequisites
-