Histograms are one of the most commonly used ways of visualising data in High Energy Physics. They are clean, detailed, and easy to plot. You can also do very interesting stuff, such as compare them, calculate goodness of fit between them, calculate statistical metrics etc. If you know what you are looking at, they are the best tool for your analysis...
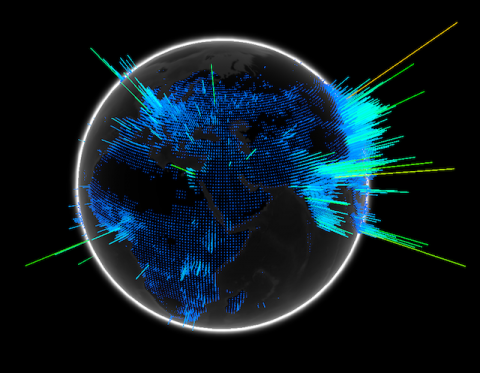
However, if you are not familliar with them, they are just a blob of lines a numbers! My idea is to think out of the box and come up with a new idea on how histograms can be visualised, so they are easy to understand by the general public. They might span in three dimentions, they might be completely abstract, be constantly animated... but the goal is to make it (a bit more) self-explainatory, so someone that sees it for the first time does not feel lost... rather engaged and interested to learn more about it.
A perfect application for this is the newly built Virtual Atom Smasher prototype: http://test4theory.cern.ch/vas that invites volunteers without any prior knowledge in particle physics to tune a monte-carlo simulation. In the game, histograms are used as the means to check how good the simulation run is, compared to the experimental measurements. However such display is rather boring, but just imagine how immersive it can become if you are looking at a 3D/Interactive/Animated visualization of these data?
Come-up with a new way of visualising the data of a histogram, and apply it as a customisation in the Virtual Atom Smasher game, that is:
- Self explainatory or at least easy to understand by anyone
- Immersive, Interesting, Stunning to the eye
- Teasing the user to learn more about it
- Understand What a histogram is
- Being able to explain "What a histogram is" to someone who doesn't have a clue!
- Thinking out of the box
- Javascript, CSS/HTML5 knowledge is a plus
- How to create a customisation in Virtual Atom Smasher: https://github.com/wavesoft/virtual-atom-smasher/wiki/Tutorial---1-Envir...
- 2D Data Visualisation : http://d3js.org/
- 3D Javscript Engine : http://threejs.org/
Prerequisites:
Understand what a histogram is, how it's used in physics, and thinking out of the box. Javascript and d3.js and/or three.js knowledge is a plus.
